DATA DIVERSITY
A UK Creative Clusters Creative Informatics Challenge Project commissioned by Fruitmarket Gallery, Edinburgh
Skills
Co-design · No-Code Development · Equality, Diversity and Inclusion (EDI)
Experience
I facilitated team recruitment and co-design of new approaches to the challenge of monitoring equality, diversity and inclusion (EDI) at the gallery and then developed the digital solution.
Approach
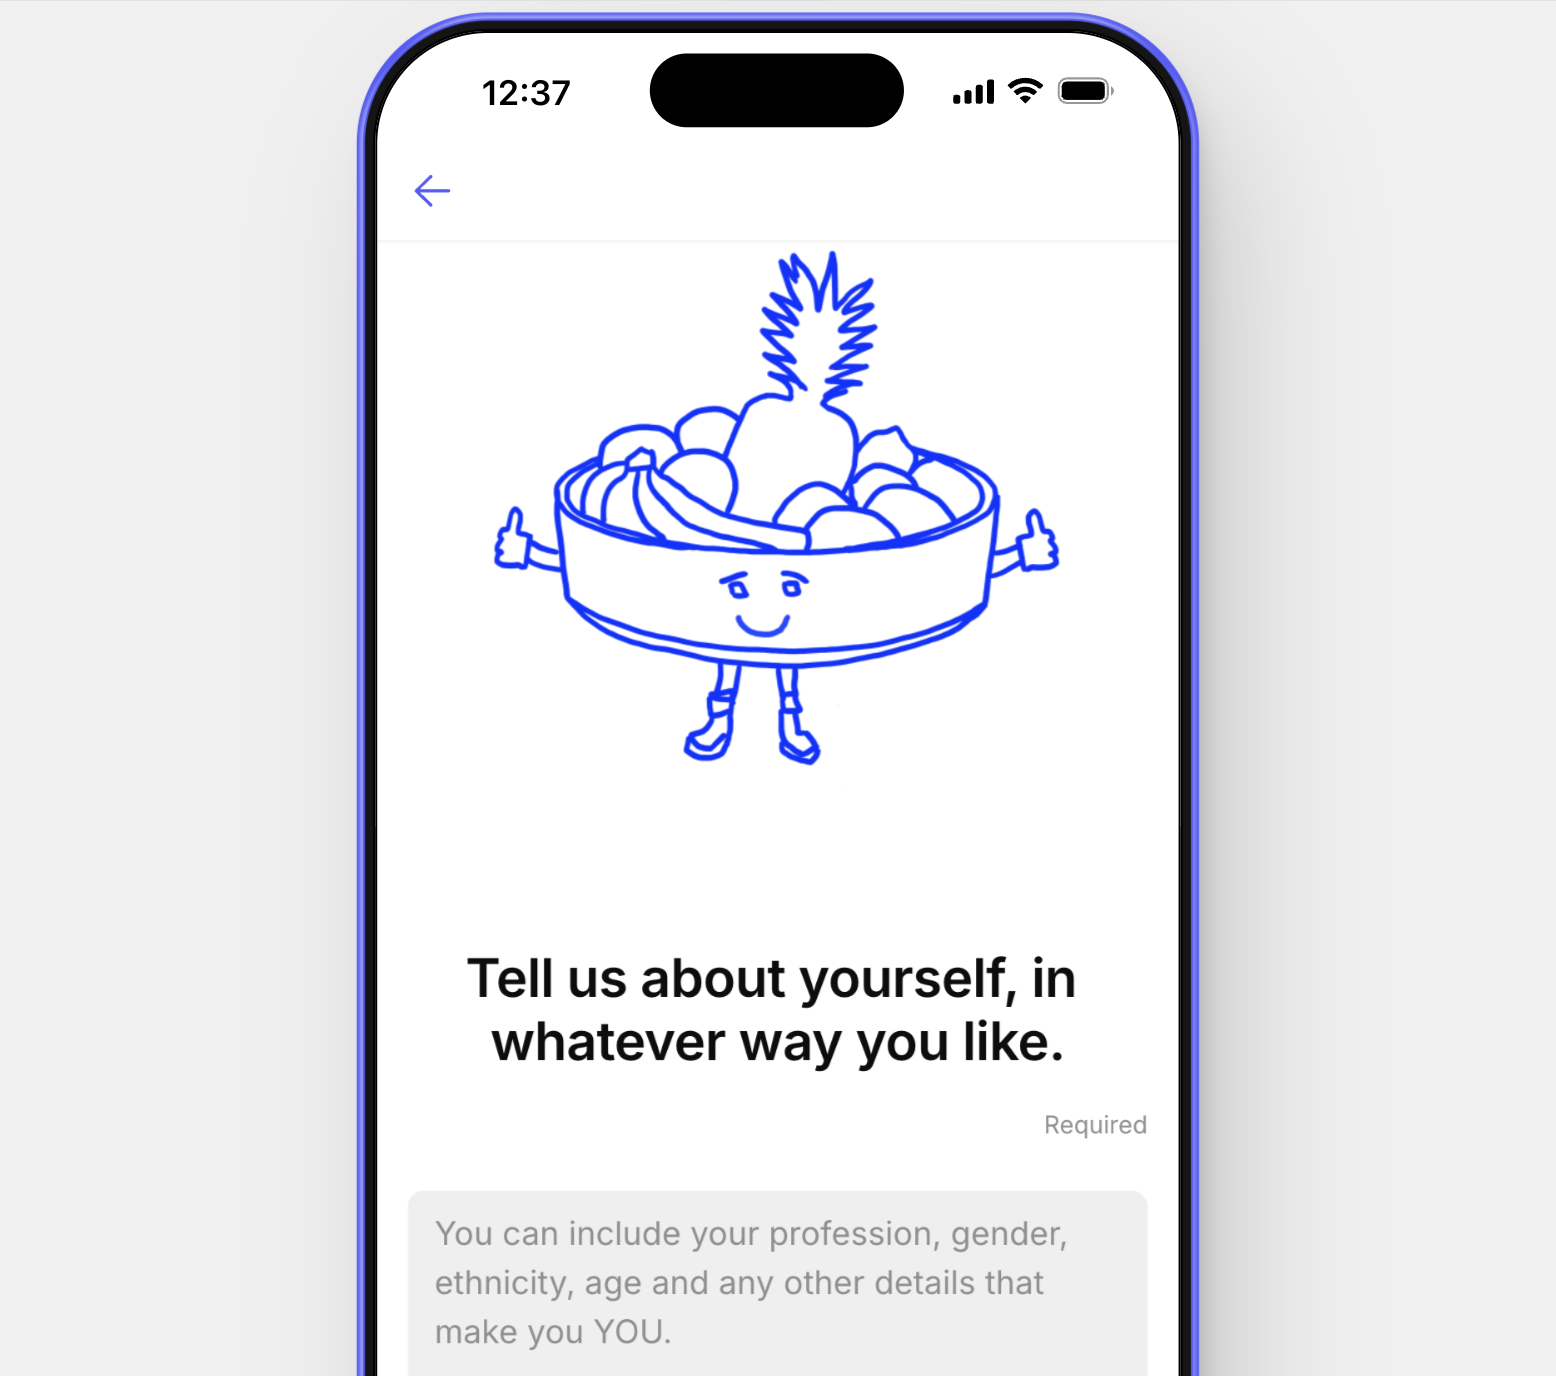
High-quality illustrated surveys, a concept arising from the co-design process I facilitated, were designed by project lead Studio Caspar and distributed to targeted gallery visitors, resulting in a rich resource of visitor responses about their perception of the gallery, their frequency of visiting and their own identities. This, along with data from Studio Caspar’s ‘vote on a note’ campaign at Fruitmarket, informed the design of a pilot app I developed which adopted the same approachable visual style, incorporating more illustrations by Studio Caspar.
This app gathered short personal narratives from gallery visitors and automatically indexed keywords from these, turning the qualitative responses into valuable quantitative EDI data for the gallery's future use.
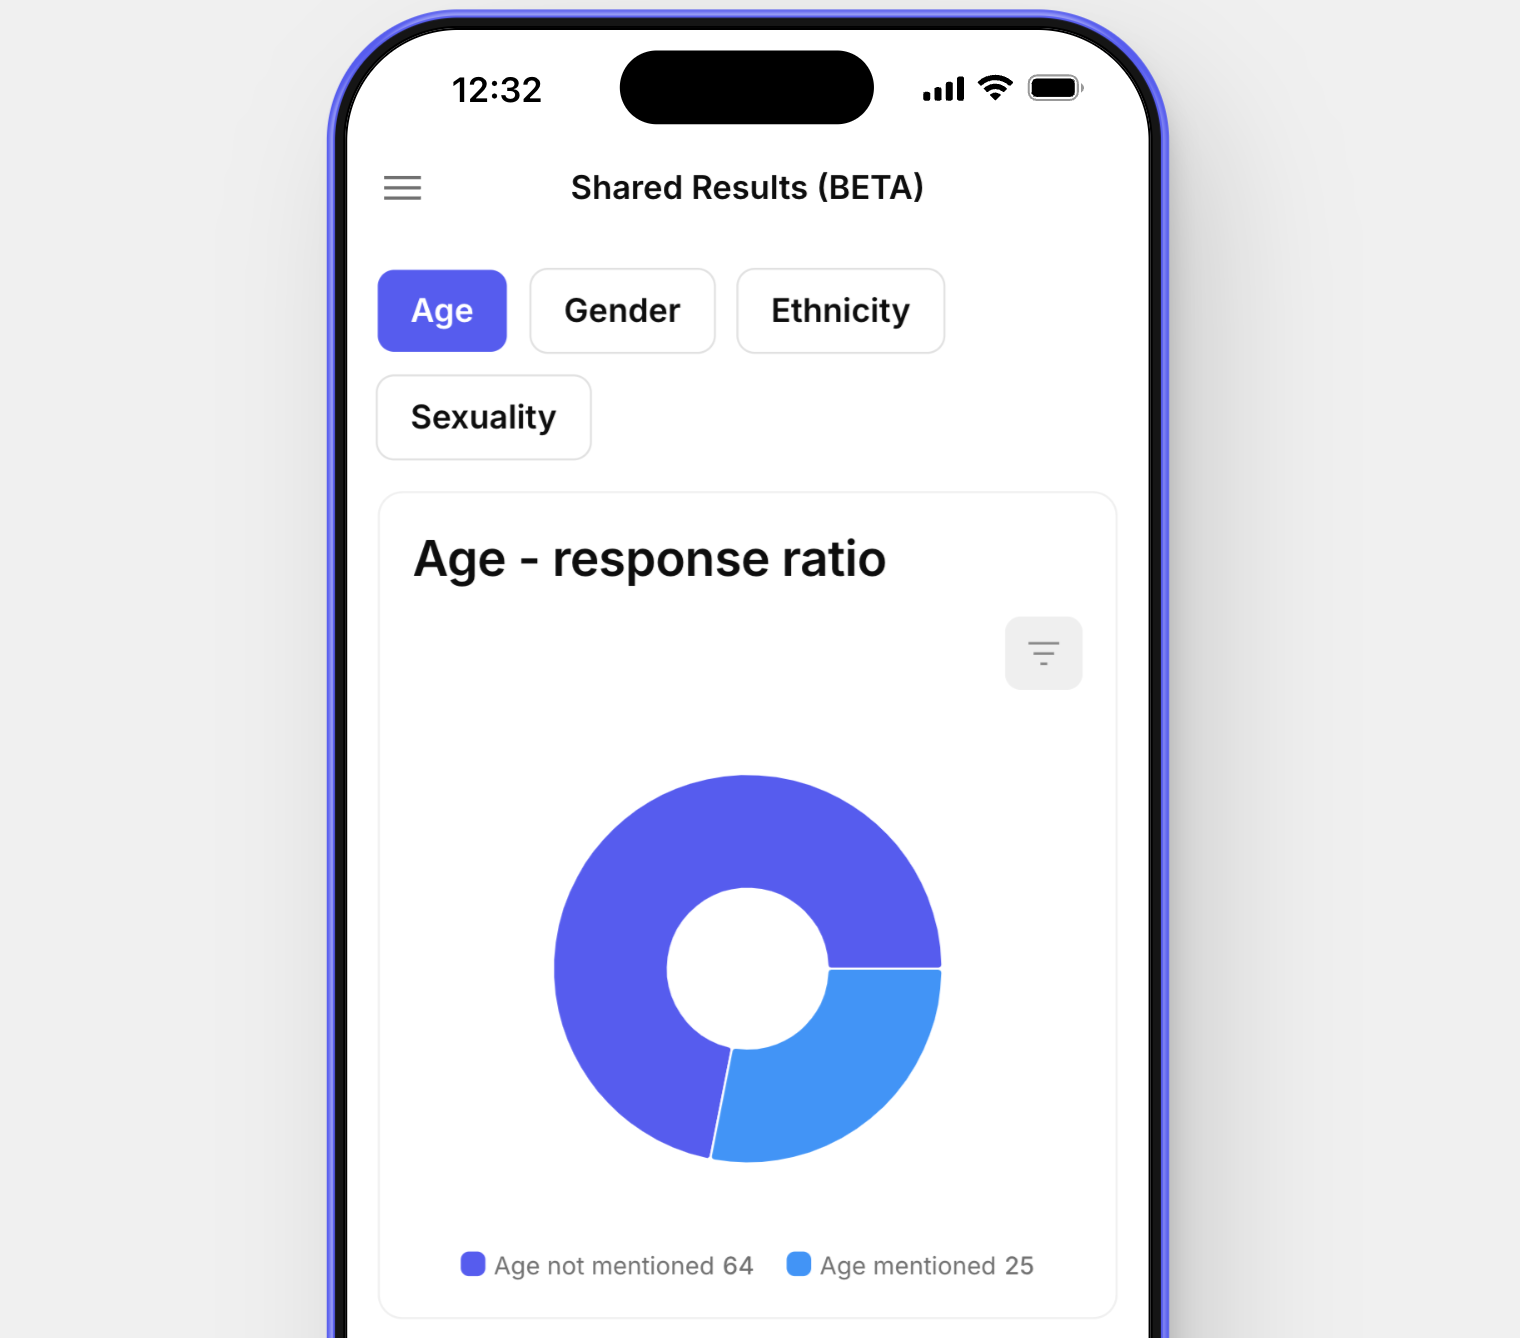
The interactive capabilities of an app offered an advantage over paper-based EDI data-gathering practices in rewarding each contributing visitor by showing them an interactive visualisation of the anonymised EDI data from all contributors after their own contribution was added. This exchange of value was an attempt to embody equality, diversity and inclusion in the data-gathering process itself.
Pictured: ‘Vote with a Note’ physical data-gathering!
Pictured: the Data Diversity team at Fruitmarket: (L-R) Kim Simpson, myself, Aisha Akinola, Caspar Wilson
While each visitor’s description of themselves didn’t ‘tick all the boxes’ from the prior paper EDI form, in aggregate far more EDI data was generated because of the much-increased rate of engagement and participation by gallery visitors in the app than in the paper alternative.
Considerations
Given the power of AI together with its ongoing unreliability, I opted to begin in the pilot app with a very simple taxonomy of keywords based on the EDI questions on the paper-based form. Visitors’ text contributions needed to match keywords exactly (by lookup rather than AI, in other words) in order to be considered a quantitative ‘box ticked’ for specific EDI characteristics.
We recommended that this data always be overseen by a dedicated in-house EDI delegate. Initially the possibility was obvious of isolated keywords being misinterpreted as EDI-relevant by the lookup creating a false ‘tick’. Therefore the organisations’s ability to overwrite entries would be essential (and not difficult given the steady but low-volume stream contributions by visitors). Later as these datasets grew over time the introduction of new technologies might be useful.
It seemed to the team that a method for human oversight would remain essential to edit quantitative conclusions from the qualitative data.
With due human attention there is every possibility that incorporating new technologies in a tool like this could legitimately free us from the ‘tyranny of the tick-box’. A process that turns suspect notions of data as ‘objective’ measurement into notions of datasets as living resources would better embody EDI principles by generating authentic reciprocity between organisations and a their patrons, rather than an institution simply extracting a status from a citizen.
Salient research steps to inform future development are three-fold:
Were the responses more truthful from our updated data-capture method and if so why.
Would our ‘reverse box-ticking’ approach lead to accelerated achievement of EDI targets as currently set.
Could the higher engagement and more qualitative data gained via the pilot app better inform policy about what kind of targets are being set in future.


